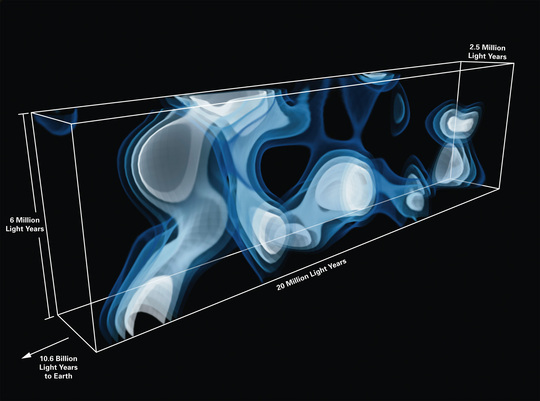
Close-up of 3D map of the Universe created by the CLAMATO team. The filamentary structures in this map span millions of light years, showing the cosmic web at an earlier stage of cosmic evolution when the Universe was less than a quarter of its current age. The structures in this map are 10.8 billion light years from Earth. The coloring represents the density of hydrogen gas tracing the cosmic web, with brighter colors indicating higher density.

Artist’s impression illustrating Lyman-alpha tomography: as light from distant background galaxies (yellow arrows) travels towards Earth, foreground hydrogen gas leaves a characteristic imprint (“absorption signature”). From this imprint, astronomers can reconstruct which clouds the light has encountered as it traverses the “cosmic web” of dark matter and gas that accounts for the biggest structures in our universe. By observing a number of background galaxies in a small patch of the sky, astronomers were able to create a 3D map of the cosmic web using a technique similar to medical computer tomography (CT) scans. The coloring represents the density of hydrogen gas tracing the cosmic web, with brighter colors representing higher density. The rendition of the cosmic web in this image is based on a supercomputer simulation of cosmic structure formation.
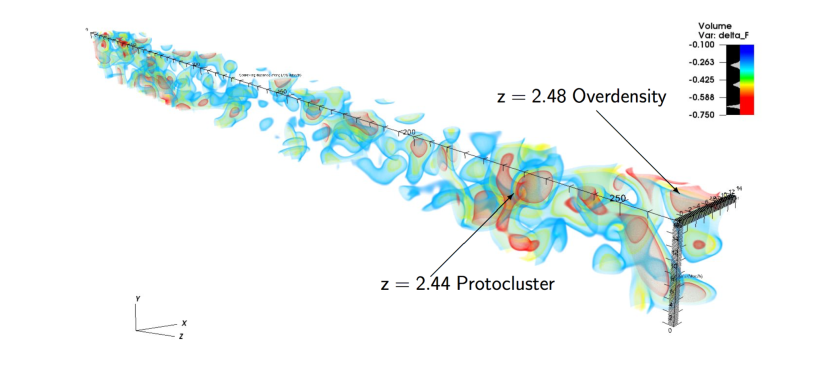
3D tomographic map of the z = 2.2 − 2.5 Lyα forest in the COSMOS field from our 2014-2015 data
A section of the CLAMATO survey map in 3-D

Projections of our Lyα forest tomographic map across 2h-1 Mpc slices in the R.A. direction, with the slice locations indicated in Figure 2. Note that negative values of dFrec (red colors) correspond to higher overdensities, while the white horizontal lines represent the skewer sampling from the background sources.Gray squares mark the positions of coeval galaxies with spectroscopic redshifts from the zCOSMOS (Lilly et al. 2007) and MOSDEF (K15) surveys. The error bars indicate the LOS uncertainties associated with LBG redshift determination, while the galaxies without error bars have NIR redshifts, in which case the symbol widths denote the LOS uncertainty. Black contours in Slices #3–5 (at z » 2.435 – 2.450) delineate regions with dsm < -3 ssm after smoothing with a 4 h-1 Mpc Gaussian, F which is the protocluster criterion defined by S15. Pink circles in Slices #3–4 indicate the z = 2.300 compact overdensity of MOSDEF galaxies within our volume.
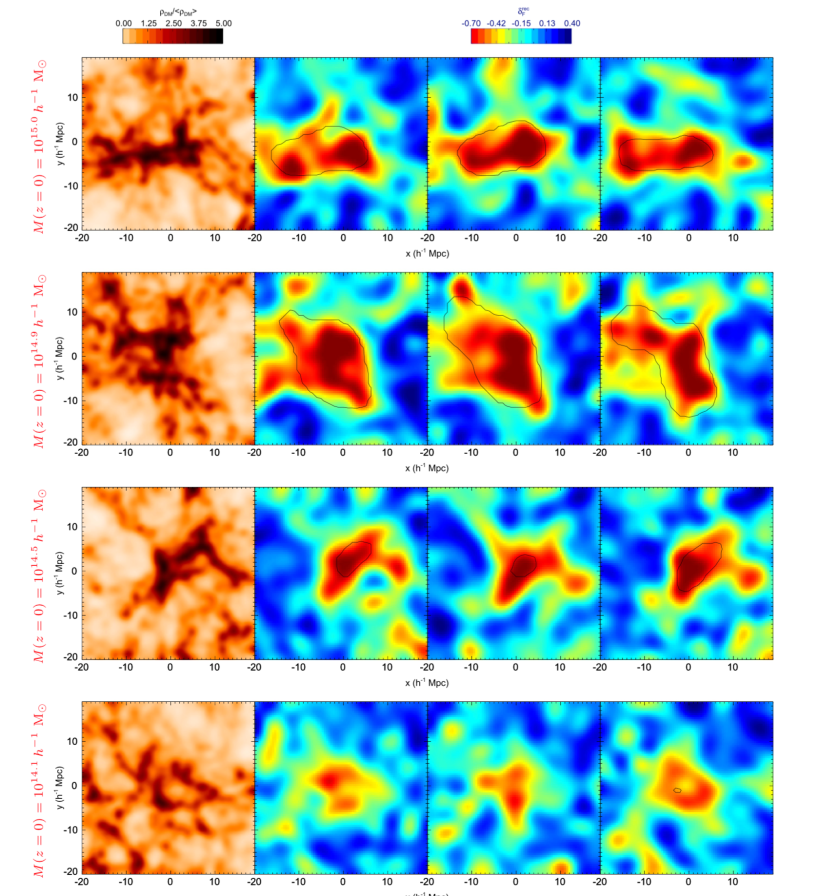
Simulated z = 2.5 galaxy protoclusters shown as projections on the sky plane with thickness 5 h-1 Mpc along the line of sight. Each map is centered on the center-of-mass of progenitor halos that will eventually collapse into z = 0 clusters with (top to bottom) M = [1.1 ́ 1015, 8.8 ́ 1014, 3.1 ́ 1014 h-1M, 1.2 ́ 1014] h-1M. The left-most panel on each row shows the underlying DM distribution (smoothed on 1 h-1 Mpc scales), while the other three panels show tomographic reconstructions from different realizations of mock Lyα forest data with similar sightline separations (ád^ñ = 2.5 h-1 Mpc) and noise as our data. The black contours overplotted on the tomographic maps indicate regions that satisfy our protocluster criterion of dsm < -3 s after smoothing. While this threshold robustly selects massive cluster progenitors with M (z = 0) 3 ́ 1014 h-1M such as on the third row, it is marginal for lower-mass protoclusters as shown on the bottom row. Note that in the second row, the lobe to the upper left ([Dx, Dy] » [-10, 8] h-1 Mpc) will in fact a collapse into a separate, albeit lower mass (M = 1.5 ́ 1014 h-1M) z ~ 0 cluster than the central object.

Examples of galaxy spectra used for our tomographic reconstruction (smoothed by a 3-pixel boxcar for clarity), along with the estimated pixel noise in red, with masked pixels set to zero. The Lyα wavelength at the galaxy redshift is indicated by the vertical dashed-lines, while the green curves shows the LBG composite template from Shapley et al. (2003) for comparison. All these background sources probe the known z=2.44 protocluster, with the pink shaded region highlighting the Lyα absorption wavelength (l » 4191 Å) at the protocluster redshift. Strong associated absorption is apparent even in these individual spectra. Orange curves indicate the estimated continuum level for each object. Note that object #00958 (3rd panel from top) has a broad Lyα emission line characteristic of an AGN, but shows strong ISM absorption redwards of Lyα and is thus treated like a galaxy for continuum-fitting.
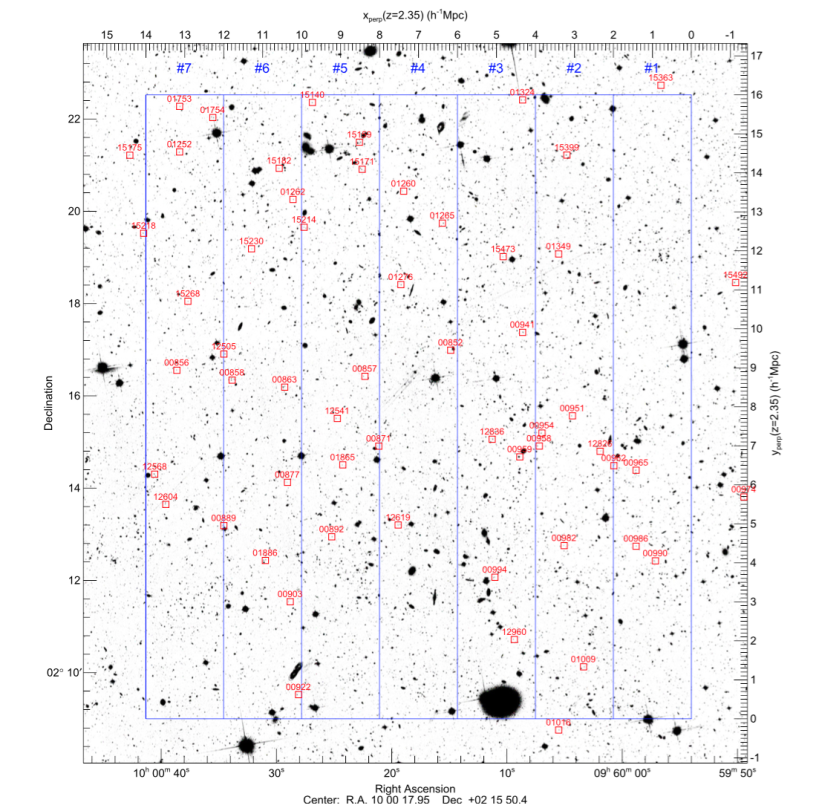
Hubble ACS image of the COSMOS field (Koekemoer et al. 2007) showing the position of our background galaxies and quasars on the sky, labeled by their ID number (Table 1). The overall blue box represents the transverse extent of our tomographic map, while the seven narrow slices indicate the footprint of the map projections shown in Figure 4. The upper- and right-axis labels denote the transverse comoving distance at z=2.35, the mean redshift of the map.
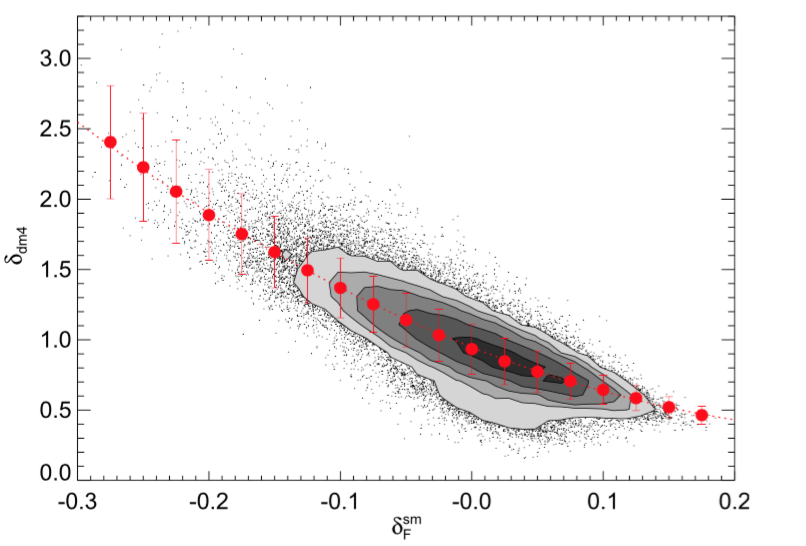
Scatter-plot of the smoothed Lyα forest tomographic map flux in our simulation against underlying DM overdensity smoothed on the same 4 h-1 Mpc scale, evaluated in (1 h-1 Mpc)3 map voxels. The contours denote the 10th, 20th, 30th, 50th and 80th percentiles of the distribution, while the red circles denote the means within bins of Ddsm = 0.02 along with the standard F deviations as error bars. The red-dotted line shows the 2nd-order polynomial fitted to the distribution